Application notes


Technical notes
Ask an engineer


Publications
United States (EN)
Select your region or country.
Spectroscopy Questions & Answers
- Is the C12666MA micro-spectrometer capable of accomplishing Raman spectroscopy measurements?
- Conventional mini-spectrometers for Raman for 785 nm excitation source
- Mini-spectrometer C13054MA
- Mini-spectrometer C14214MA
- What is spectral resolution?
- Why use a spectrometer for color measurement? Can’t my RGB sensor do that for cheaper?
Is the C12666MA micro-spectrometer capable of accomplishing Raman spectroscopy measurements?
Typically, the C12666MA micro-spectrometer is not suitable for most Raman applications for two primary reasons: resolution and sensitivity.
Resolution
The C12666MA is a very small, versatile, and relatively low-cost spectrometer. However, achieving these design objectives required trade-offs in spectrometer performance such as spectral resolution. Per the C12666MA data sheet , the maximum resolution of the spectrometer is around 15 nm. This does vary over wavelength (see Fig. 1) with the best resolution occurring around 450 nm.
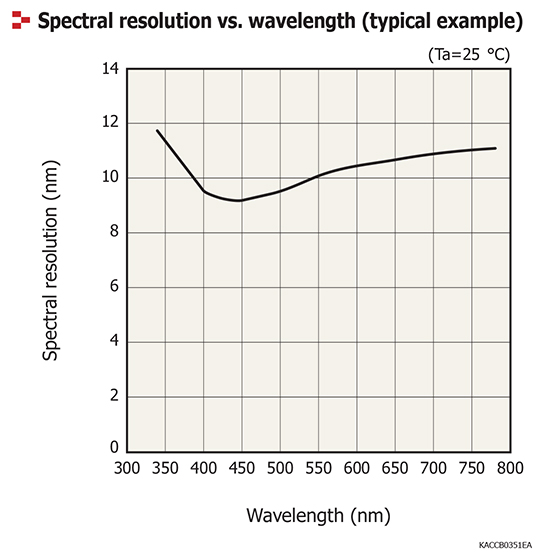
Figure 1: C12666MA’s spectral resolution
In much of Raman spectroscopy, it is important to have better than 1 nm resolution typically—and sometimes much less than 1 nm—to resolve molecular peaks that may be close in spectral proximity. It is also often important that the spectrometer’s FWHM resolution provide enough granularity and detail in the spectral peaks to be able to properly determine molecular identity and concentration. Generally, the C12666MA’s resolution is not sufficient to resolve closely spaced molecular peaks when analyzing Raman spectral information.
Sensitivity
Typical Raman analysis also needs relatively high sensitivity. Because Raman scattering is a low level, inelastic scattering effect and since measurements usually use just the Stokes scattered light, only a portion of all the scattered light is captured during measurements. Most Raman analysis applications deal with very low light levels, so the spectrometer used should have relatively high sensitivity to detect the very low light levels.
The C12666MA is based upon CMOS image sensor technology. It offers good sensitivity for its physical size, cost, spectral range, and resolution but usually does not offer sufficient sensitivity to accomplish most very low light Raman analysis. Fig. 2 shows the C12666MA’s relative sensitivity, which varies across its spectral response range with peak sensitivity occurring around 500 nm. This indicates that Raman signals near the peak sensitivity may be measurable, but perhaps signal peaks at other wavelengths may not be observable.
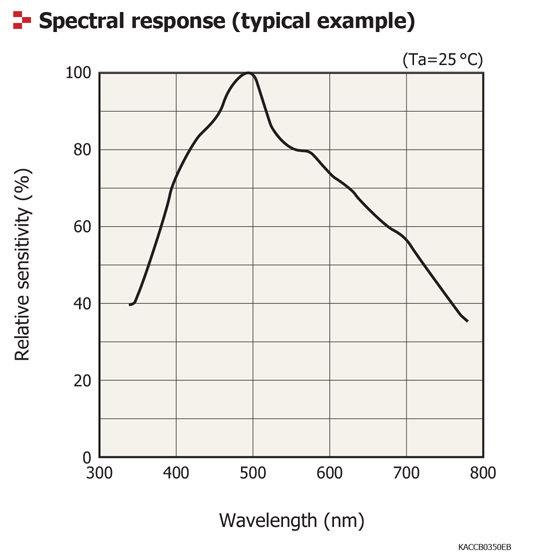
Figure 2: C12666MA’s relative sensitivity
Spectrometers suitable for Raman
Although the C12666MA is not typically suitable for Raman analysis, a few customers have achieved low-resolution Raman analysis for certain applications using the C12880MA micro-spectrometer data sheet.
The C12880MA has a slightly wider spectral response range (340 to 850 nm, with resolution peaking at around 425 nm) and a higher sensitivity based upon its APS-CMOS (Active Pixel Structure CMOS) image sensor. The APS-CMOS image sensor yields a significant improvement in spectral sensitivity (peaking at around 500 nm) over the sensitivity of the C12666MA, which uses a different CMOS image sensor. The spectral response plots for the C12880MA are shown in Fig. 3 and 4.
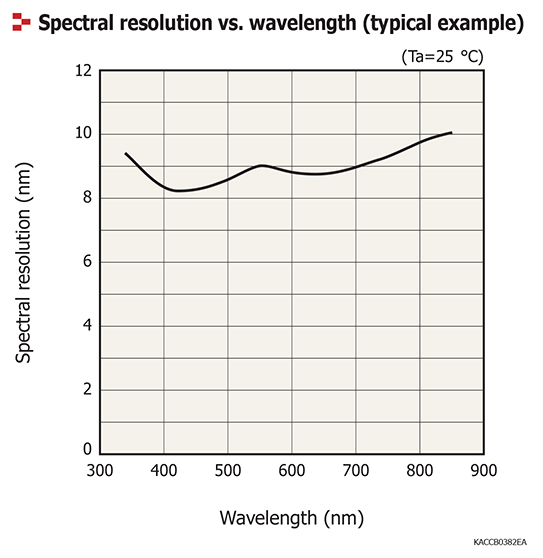
Figure 3: C12880MA’s spectral resolution
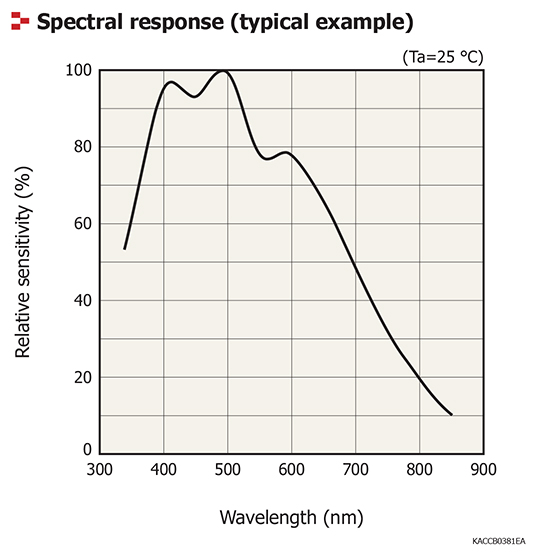
Figure 4: C12880MA’s relative sensitivity
The Raman applications that used the C12880MA were unusual since the performance requirements were loose enough to accommodate the operational specifications of the micro-spectrometer, but this is generally not expected to be the case in typical Raman measurement.
The C12666MA and C12880MA micro-spectrometers will typically not provide sufficient spectral sensitivity and resolution to accommodate most Raman applications. But do review the requirements of the application just in case your implementation may be the exception to this generalization.
Also, Hamamatsu does offer small mini-spectrometer models that were specifically designed for Raman applications. They have the higher performance characteristics typical of Raman spectrometers, including relatively high resolution and high sensitivity.
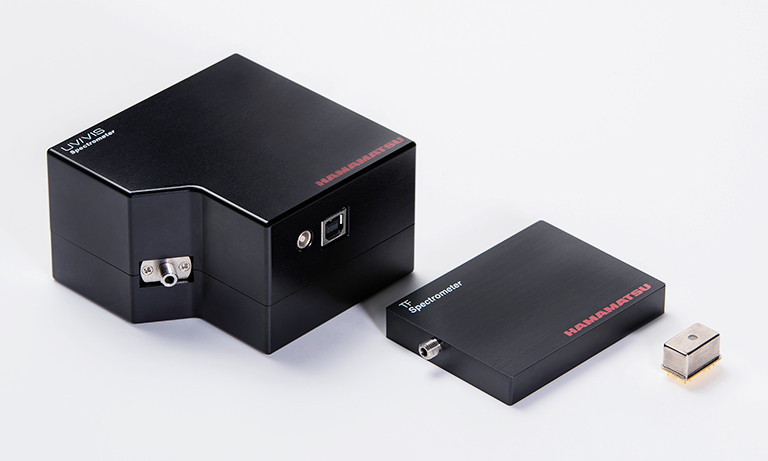
Conventional mini-spectrometers for Raman for 785 nm excitation source
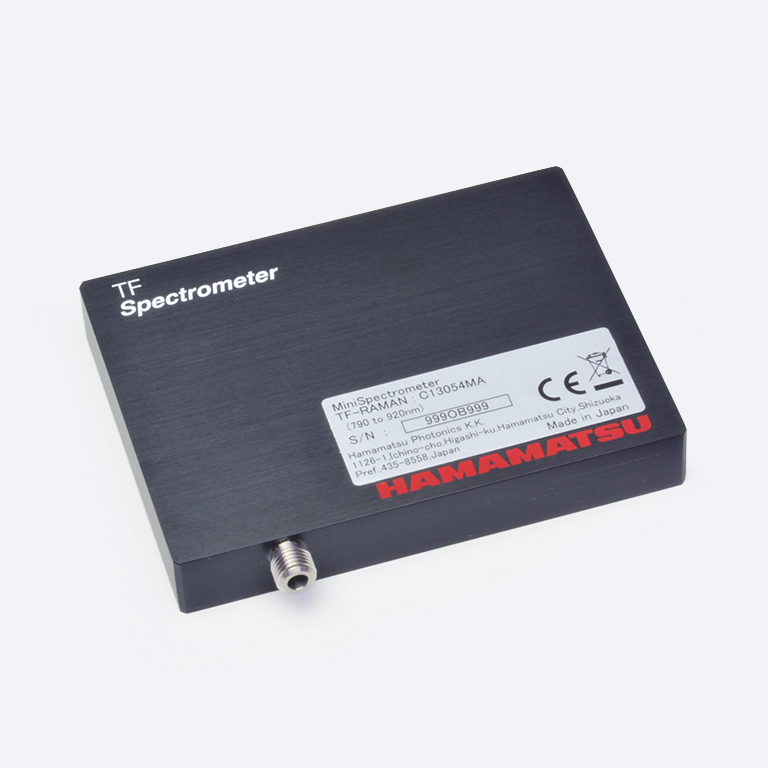
- APS-CMOS based
- Small, thin, flat form factor
- Low cost
- Spectral range: 790 - 920 nm
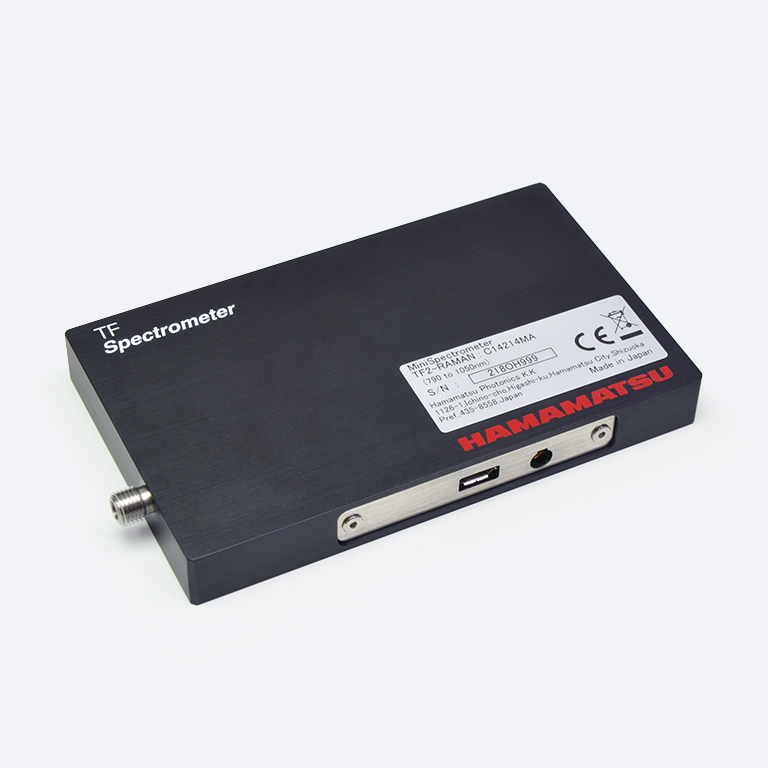
- APS-CMOS based
- Small, thin, flat form factor
- Low cost
- Spectral range: 790 - 1050 nm
What is spectral resolution?
Resolution should always be considered when selecting a spectrometer, as many applications require a certain resolution to be successful. If you imagine a random spectrum in your head, I bet there are a bunch of peaks large and small. Resolution is essentially the ability to discriminate peaks of the same intensity within a certain wavelength window. A good example would be to think of your typical camera and its ability to focus on certain aspects of an image.
One popular method to define spectral resolution uses the Rayleigh criterion in DIN (Deutsches Institut für Norming) standards, for which the valley between the two peaks must be lower than 81% of the peak value.
On the other hand, a practical alternative for defining spectral resolution is the spectral half-width or FWHM (full width at half maximum). This is the spectral width at 50% of the peak value and directly defines the extent of spectral broadening. The more broadening you have, the more information you may be losing within the peak. The spectral resolution defined as FWHM is approximately 80% of the resolution defined by the Rayleigh criterion. The spectral resolution of Hamamatsu mini-spectrometers is defined by FWHM.
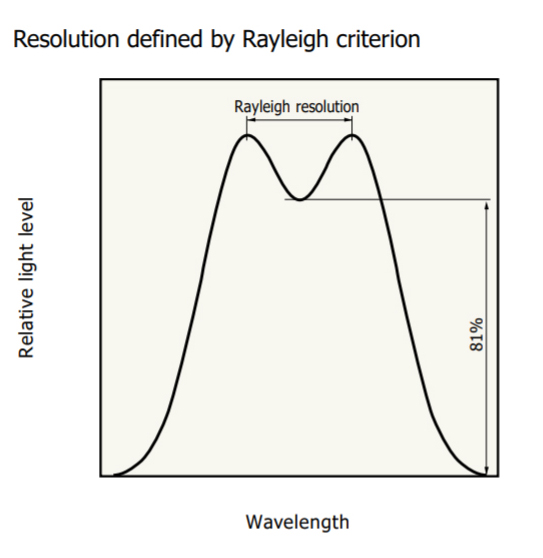
Figure 5a: Resolution defined by Rayleigh criterion
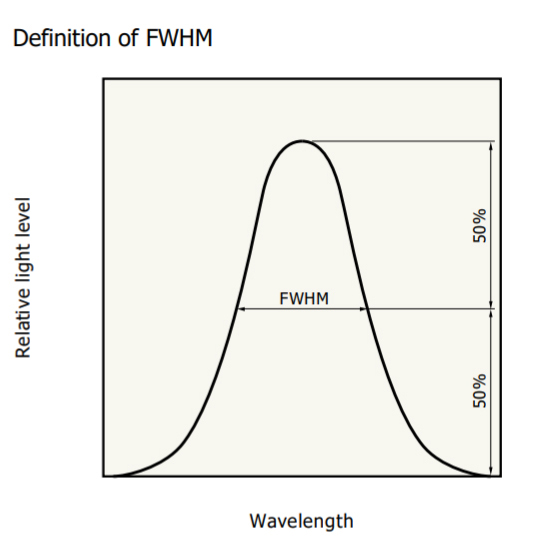
Figure 5b: Definition of FWHM
Another thing to note is that your spectrometer’s resolution may have wavelength dependence. More resolution is especially important in cases of chemical fingerprinting, where minute changes in purity and identification of functional groups depend on the ability to find small differences in interaction.
Why use a spectrometer for color measurement? Can’t my RGB sensor do that for cheaper?
There is nothing wrong with an RGB sensor + photo IC solution, but certain color measurement applications require a higher resolution (finer detail) than a simple RGB solution can provide. There may be considerable information within even the smallest change in light level and/or color. Food safety/quality, fluorescence, medical applications, and oil/fluid quality are all prime examples of the potential applications that require such a level of resolution. These applications of the future are simply beyond the capability of RGB sensors. A sensor with the ability to detect such small changes opens up many possibilities for new markets, and in terms of price, you would be surprised how competitive our spectrometers are. One example of the C12666MA’s prowess can be found here: https://www.nature.com/articles/srep32504
If you have a technical question you’d like to see answered on this page, email us.
Meet the engineers

As an Applications Engineer in the New Jersey office of Hamamatsu, Dana Hinckley’s primary technical focus is on the mini- and micro-spectrometers and MEMS-FPI spectral sensors. He especially enjoys the wide range of applications and the daily dose of education in science, engineering, and spectroscopy, along with the myriad implementations in which our customers employ the spectral analysis tools. In his off-hours, Dana enjoys a wide palette of interests: spending time with family and friends, guitar playing, and music are some of his more predominant pastimes.

Gary Spingarn is a Product Manager in the New Jersey office of Hamamatsu, where he focuses on business development for certain products and exploring new applications. Leveraging his chemistry expertise, Gary supports the mid-infrared (MIR) product lines with a particular knack for process monitoring, gas analysis, and environmental applications. In his spare time, Gary hones his chess skills as well as partakes in strength sports and world travel.
- Confirmation
-
It looks like you're in the . If this is not your location, please select the correct region or country below.
You're headed to Hamamatsu Photonics website for US (English). If you want to view an other country's site, the optimized information will be provided by selecting options below.
In order to use this website comfortably, we use cookies. For cookie details please see our cookie policy.
- Cookie Policy
-
This website or its third-party tools use cookies, which are necessary to its functioning and required to achieve the purposes illustrated in this cookie policy. By closing the cookie warning banner, scrolling the page, clicking a link or continuing to browse otherwise, you agree to the use of cookies.
Hamamatsu uses cookies in order to enhance your experience on our website and ensure that our website functions.
You can visit this page at any time to learn more about cookies, get the most up to date information on how we use cookies and manage your cookie settings. We will not use cookies for any purpose other than the ones stated, but please note that we reserve the right to update our cookies.
1. What are cookies?
For modern websites to work according to visitor’s expectations, they need to collect certain basic information about visitors. To do this, a site will create small text files which are placed on visitor’s devices (computer or mobile) - these files are known as cookies when you access a website. Cookies are used in order to make websites function and work efficiently. Cookies are uniquely assigned to each visitor and can only be read by a web server in the domain that issued the cookie to the visitor. Cookies cannot be used to run programs or deliver viruses to a visitor’s device.
Cookies do various jobs which make the visitor’s experience of the internet much smoother and more interactive. For instance, cookies are used to remember the visitor’s preferences on sites they visit often, to remember language preference and to help navigate between pages more efficiently. Much, though not all, of the data collected is anonymous, though some of it is designed to detect browsing patterns and approximate geographical location to improve the visitor experience.
Certain type of cookies may require the data subject’s consent before storing them on the computer.
2. What are the different types of cookies?
This website uses two types of cookies:
- First party cookies. For our website, the first party cookies are controlled and maintained by Hamamatsu. No other parties have access to these cookies.
- Third party cookies. These cookies are implemented by organizations outside Hamamatsu. We do not have access to the data in these cookies, but we use these cookies to improve the overall website experience.
3. How do we use cookies?
This website uses cookies for following purposes:
- Certain cookies are necessary for our website to function. These are strictly necessary cookies and are required to enable website access, support navigation or provide relevant content. These cookies direct you to the correct region or country, and support security and ecommerce. Strictly necessary cookies also enforce your privacy preferences. Without these strictly necessary cookies, much of our website will not function.
- Analytics cookies are used to track website usage. This data enables us to improve our website usability, performance and website administration. In our analytics cookies, we do not store any personal identifying information.
- Functionality cookies. These are used to recognize you when you return to our website. This enables us to personalize our content for you, greet you by name and remember your preferences (for example, your choice of language or region).
- These cookies record your visit to our website, the pages you have visited and the links you have followed. We will use this information to make our website and the advertising displayed on it more relevant to your interests. We may also share this information with third parties for this purpose.
Cookies help us help you. Through the use of cookies, we learn what is important to our visitors and we develop and enhance website content and functionality to support your experience. Much of our website can be accessed if cookies are disabled, however certain website functions may not work. And, we believe your current and future visits will be enhanced if cookies are enabled.
4. Which cookies do we use?
There are two ways to manage cookie preferences.
- You can set your cookie preferences on your device or in your browser.
- You can set your cookie preferences at the website level.
If you don’t want to receive cookies, you can modify your browser so that it notifies you when cookies are sent to it or you can refuse cookies altogether. You can also delete cookies that have already been set.
If you wish to restrict or block web browser cookies which are set on your device then you can do this through your browser settings; the Help function within your browser should tell you how. Alternatively, you may wish to visit www.aboutcookies.org, which contains comprehensive information on how to do this on a wide variety of desktop browsers.
5. What are Internet tags and how do we use them with cookies?
Occasionally, we may use internet tags (also known as action tags, single-pixel GIFs, clear GIFs, invisible GIFs and 1-by-1 GIFs) at this site and may deploy these tags/cookies through a third-party advertising partner or a web analytical service partner which may be located and store the respective information (including your IP-address) in a foreign country. These tags/cookies are placed on both online advertisements that bring users to this site and on different pages of this site. We use this technology to measure the visitors' responses to our sites and the effectiveness of our advertising campaigns (including how many times a page is opened and which information is consulted) as well as to evaluate your use of this website. The third-party partner or the web analytical service partner may be able to collect data about visitors to our and other sites because of these internet tags/cookies, may compose reports regarding the website’s activity for us and may provide further services which are related to the use of the website and the internet. They may provide such information to other parties if there is a legal requirement that they do so, or if they hire the other parties to process information on their behalf.
If you would like more information about web tags and cookies associated with on-line advertising or to opt-out of third-party collection of this information, please visit the Network Advertising Initiative website http://www.networkadvertising.org.
6. Analytics and Advertisement Cookies
We use third-party cookies (such as Google Analytics) to track visitors on our website, to get reports about how visitors use the website and to inform, optimize and serve ads based on someone's past visits to our website.
You may opt-out of Google Analytics cookies by the websites provided by Google:
https://tools.google.com/dlpage/gaoptout?hl=en
As provided in this Privacy Policy (Article 5), you can learn more about opt-out cookies by the website provided by Network Advertising Initiative:
http://www.networkadvertising.org
We inform you that in such case you will not be able to wholly use all functions of our website.
Close