Application notes
Technical notes
Ask an engineer
Publications
United States (EN)
Select your region or country.
Do you need libraries?
Ellen Miseo, PhD, Hamamatsu Corporation
June 14, 2016
Introduction
In laboratory-based analysis of optical spectra, one of the standard methods of reducing the data is to search a spectrum of a sample against a library of spectra of known materials. This is the approach that is used in many college-level chemistry classes, and it leads a novice user to assume that you need libraries for any spectroscopic analysis. But this assumption is not really valid. In this note, we discuss when libraries are necessary and when they are not.
Types of analytical measurements
Optical spectroscopic analytical techniques are divided into the classes of ultraviolet, visible, near- and mid-infrared based on the type of electromagnetic change that is being measured, the instrument being used, and the definition used by the scientist. All the definitions in the discussion below are definitions used by chemists and are also dependent on instrumentation, particularly the detectors used in the instrumentation.
When a spectroscopist measures a spectrum, they are typically interested in either the identification of the material (qualitative analysis) or how much of a particular compound is present (quantitative analysis).
UV-Vis
In the ultraviolet and visible region of the spectrum (220 to 750 nm), the spectra are due to electronic transitions. These transitions are electronic in nature and many molecules with similar structures have similar transitions. For example, most compounds that have an aromatic ring absorb ultraviolet light at 254 nm. This means that a spectrum might be class specific but not indicative of the molecule itself.
Near-infrared
The near-infrared region of the spectrum is typically defined as 750 nanometers to 2,500 nanometers. Spectra in this region are due to overtones of the fundamental absorbances in the mid-infrared. These overtones result from fundamental vibrations of C-H, N-H, and O-H bonds in molecules, and unfortunately overlap with each other. This means that although identification of a material is possible from its near-infrared spectrum, it is not as straightforward as it can be in the mid-infrared.
Mid-infrared and Raman
An infrared spectrum results from the absorbance of infrared radiation — usually in the range of 4,000 to 400 cm-1 (2,500 to 25,000 nanometers) — by a sample. This region of spectral absorbance corresponds to the energy necessary to excite bonds in most organic molecules and in some inorganic molecules. Since the absorbance frequency is impacted by the environment of the bond, and there are many bonds in an organic molecule, the collection of these absorbances provides a unique signature for a compound.
A Raman spectrum, although a different measurement technique, results from the same vibrational transitions as the infrared. So a Raman spectrum is also specific for the molecule of interest. The problem with Raman is that it is a very weak effect. To combat that, surface-enhanced Raman spectroscopy (SERS) is employed. Unfortunately as you change the measurement conditions, such as employing SERS rather than normal Raman, intensities of the Raman bands and sometimes their positions will change.
Analytical spectral regions and the physical processes responsible for absorption in that region.
| Type | Spectral Range | |
|---|---|---|
| UV/Vis | 200 to 750 nm | Absorptions are due to transitions of electrons |
| Near IR | 750 to 2000 nm | Absorptions are due to the absorptions from overtones and combinations of bands of fundamental vibrations mainly of atoms bonded to hydrogen such as -OH, -NH, CH |
| Mid IR | 2 μm (2000 nm) to 25 μm Also expressed as cm-1 4000 to 400 cm-1 |
Absorptions are due to fundamental vibration of atoms bonded to other atoms including CH, OH, CO, CN, etc. |
How libraries are developed
In 1905, William W. Coblentz compiled the first information on structure/spectral correlations in many classes of compounds.1 This compilation — and the recognition of chemists that there was a correlation between spectrum and structure—began the science of infrared spectroscopy.
Following the work of Coblentz, scientists recognized that infrared light can be used as an identification method. With that recognition, scientists began to generate collections of spectra of known materials for qualitative analysis. These spectra, whether infrared or Raman, show sharp absorbances indicative of chemical functionality. The shape and position can also indicate the environment surrounding that functionality. Taking into account all the factors that impact a peak position and intensity, a skilled person can interpret the spectrum to deduce the structure.
Since Raman scattering and infrared absorbance are complementary techniques (both are due to the same chemical structures, but different due to the mechanism producing the spectral feature), the two spectra can be used to unequivocally interpret and identify a chemical structure. This has led to the demand for libraries of known materials.
When building a library, there are a number of factors that can impact the spectral signature. How the material is sampled, how it is presented to the spectrometer, and even instrument and data processing parameters can all change the appearance of a spectrum. Once the spectrum is collected, it is typically normalized (strongest peak set to 1) for inclusion in the library. Finally, if the spectrum is collected at a high spectral resolution, then it may be de-resolved before inclusion in the library.
Library searches and HQI
Searching has come a long way since the days of opening a book and looking for the strongest peak, but the technique also has its limitations. With the advent of computerized data systems a number of algorithms were developed to search through extensive databases. Results of searches are usually reported as a numerical result called a Hit Quality Index (HQI) from the search software. This HQI can be interpreted as a goodness of fit of the experimental spectrum to the library standards if the user understands the parameters that they represent. Figure 1 shows an example of a library search, but this search used a library that was not appropriate for the sample. In Figure 2, the chosen library, an adhesives database, was used and the identification was appropriate.
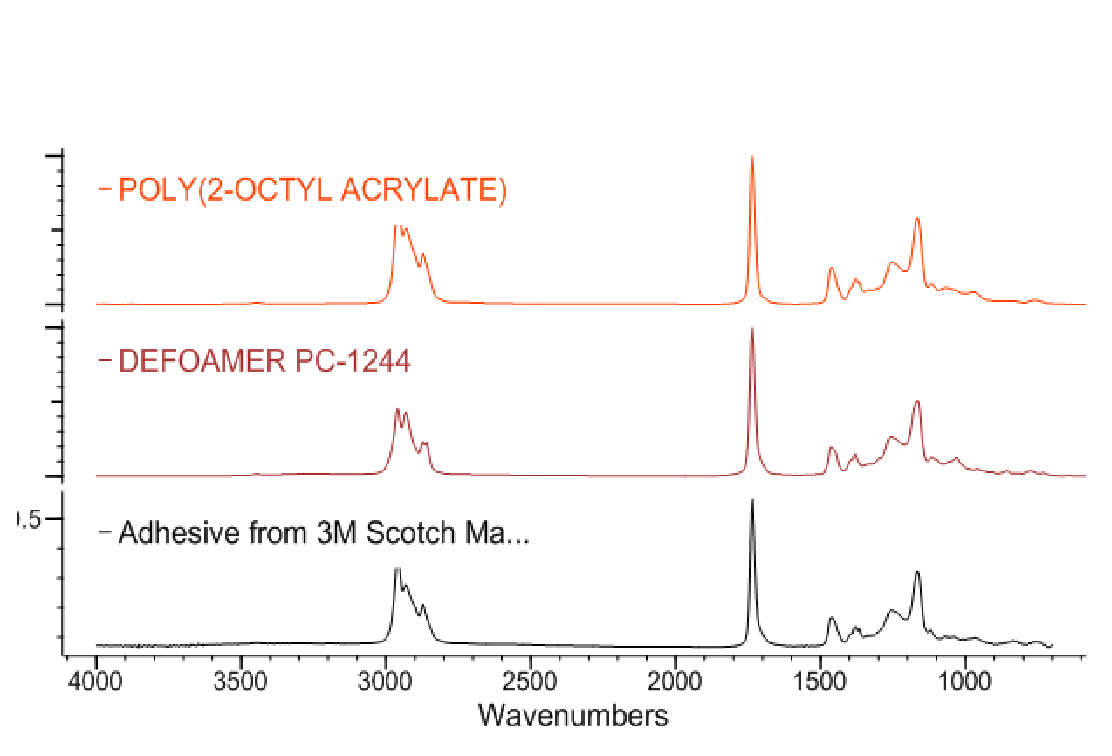
Figure 1. Results of using a library for a search of an infrared spectrum. The libraries chosen were not appropriate for the sample, thus the identification is not correct.
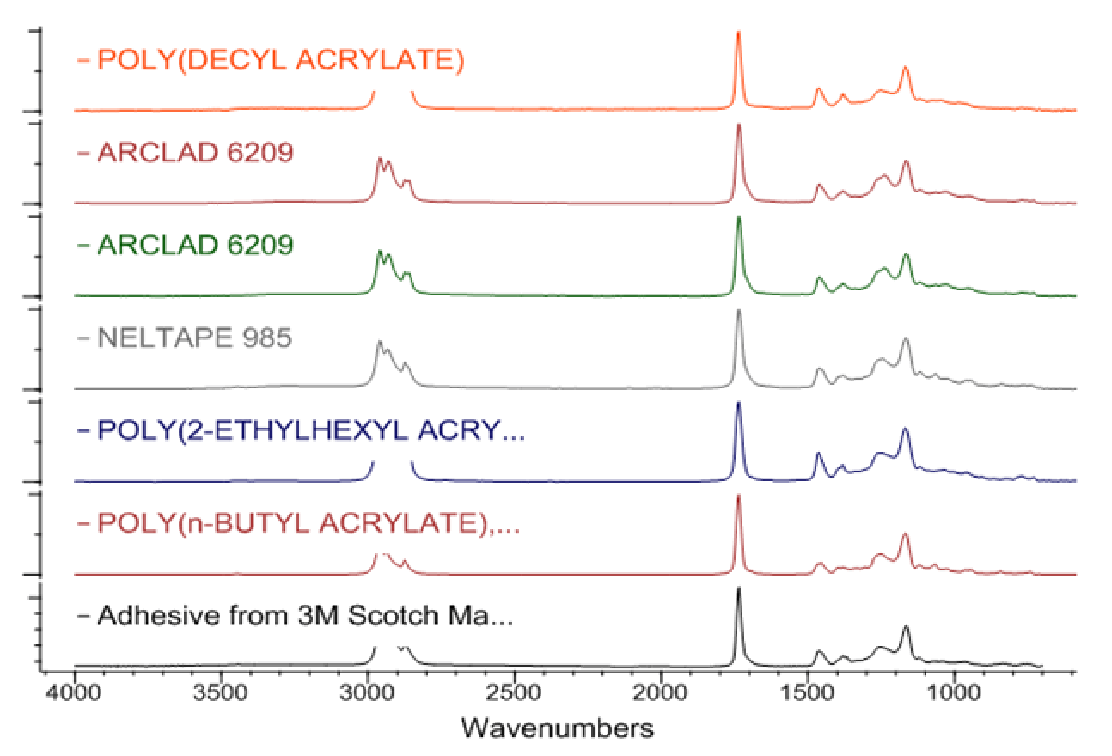
Figure 2. Results of using a library for a search of an infrared spectrum where the libraries chosen were appropriate for the sample. The identification is correct.
The HQI represents mathematically, based on the search algorithm used, how well the library spectrum fits to the experimental spectrum. But baseline effects, noise, contaminants, and how the spectrum was collected all will impact this number. Another factor that will directly impact the search results is the algorithm used. And all these factors are dependent on the unknown actually being in the library and the library being appropriate to the nature of the sample.2
So do you need spectral libraries?
In a quantitative analysis, the important point is the calibration curve (the relationship between the changes in absorbance in the spectrum to the concentration). This requires that you have the spectrum of the material of interest, and accurately vary the concentration while measuring the absorbance at a particular pathlength. This type of analysis relies on the Beer-Lambert law, which relates concentration to pathlength and absorbance.3 Since the purpose of a quantitative analysis is to determine how much of a material is present, the analyst must know beforehand the spectrum of the material he is quantifying. A good calibration curve is necessary, but libraries are not because in the method development spectra are collected at different concentrations. Figure 3 illustrates a calibration curve in good agreement with Beer’s law and can be used to determine the amount of high fructose corn syrup in soft drinks.
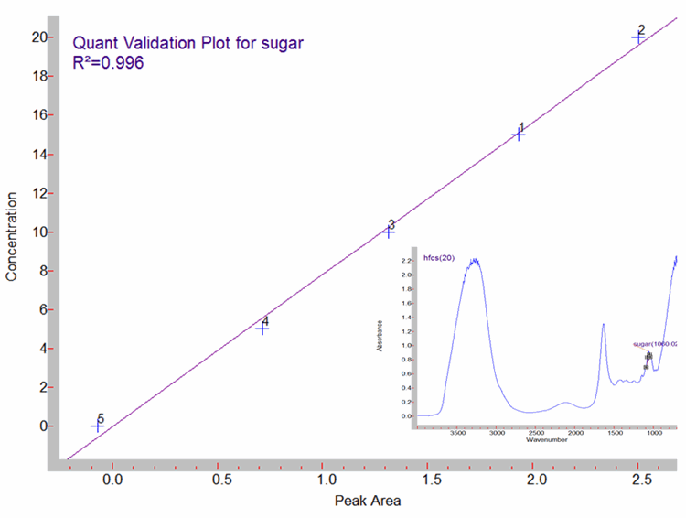
Figure 3. Beer's law calibration for high fructose corn syrup in soft drinks. The inset spectrum is of the highest concentration in water, 20% (w/v).
For qualitative analysis, the situation is different. Many of the applications for which Hamamatsu spectral devices are used are aimed at identification of a small set of materials. When spectral searching is used, the most accurate results are obtained when the spectra of known materials are collected on the same class of instrument, with the same sampling procedure, under the same conditions. The most effective implementations of spectra searching use libraries that have been acquired with these constraints in mind.
As the above discussion shows, there are few applications that Hamamatsu customers will encounter where library spectra are necessary. But when a library is necessary, where do you get them? Since libraries are used in chemical quantitative analysis, there are a number of sources of this information. The most accurate libraries are from commercial vendors who sell libraries. These libraries have been subjected to quality control procedures and generally are good quality spectra that represent the compound of interest. Companies such as Bio-Rad, ACD/Labs, and S.T. Japan-USA all supply both infrared and Raman libraries. For near-infrared libraries, Bio-Rad and S.T. Japan-USA can provide databases. In the UV and visible, Bio-Rad can provide commercial databases.
It should be noted that these libraries contain common materials collected under "standard spectral conditions," which means that they will not be exact matches to a spectra collected under different conditions. The instrument design and sampling both impact the spectrum and, in the case of Raman, the excitation wavelength. Finally, a user of libraries should recognize that even the most diligent library vendor can make a mistake and so the user should verify the spectrum themselves.
Conclusion
Libraries can help in the interpretation of a spectrum of a material. They are best used in a situation where there are a large number of choices for identification. Since many of the applications where Hamamatsu mini- and micro-spectrometers are applied are a very small subset of compounds or systems, it is much better to collect a spectrum of the material of interest under conditions representing the final analysis. If libraries are important, then commercial libraries can be purchased as long as the user recognizes the limitation of these libraries.
References
- Coblentz, W.W., Investigations of Infra-red Spectra. 1905, Washington, D.C.: Carnegie Institution of Washington.
- ASTM International, Standard Guide for Use of Spectral Searching by Curve Matching Algorithms with Data Recorded Using Mid-Infrared Spectroscopy, in ASTM E2310-04(2015) 2015, ASTM International: West Conshohocken, PA, 2015.
- Harris, D.C., Quantitative Chemical Analysis. 7th edition 2006: W. H. Freeman.
- Confirmation
-
It looks like you're in the . If this is not your location, please select the correct region or country below.
You're headed to Hamamatsu Photonics website for US (English). If you want to view an other country's site, the optimized information will be provided by selecting options below.
In order to use this website comfortably, we use cookies. For cookie details please see our cookie policy.
- Cookie Policy
-
This website or its third-party tools use cookies, which are necessary to its functioning and required to achieve the purposes illustrated in this cookie policy. By closing the cookie warning banner, scrolling the page, clicking a link or continuing to browse otherwise, you agree to the use of cookies.
Hamamatsu uses cookies in order to enhance your experience on our website and ensure that our website functions.
You can visit this page at any time to learn more about cookies, get the most up to date information on how we use cookies and manage your cookie settings. We will not use cookies for any purpose other than the ones stated, but please note that we reserve the right to update our cookies.
1. What are cookies?
For modern websites to work according to visitor’s expectations, they need to collect certain basic information about visitors. To do this, a site will create small text files which are placed on visitor’s devices (computer or mobile) - these files are known as cookies when you access a website. Cookies are used in order to make websites function and work efficiently. Cookies are uniquely assigned to each visitor and can only be read by a web server in the domain that issued the cookie to the visitor. Cookies cannot be used to run programs or deliver viruses to a visitor’s device.
Cookies do various jobs which make the visitor’s experience of the internet much smoother and more interactive. For instance, cookies are used to remember the visitor’s preferences on sites they visit often, to remember language preference and to help navigate between pages more efficiently. Much, though not all, of the data collected is anonymous, though some of it is designed to detect browsing patterns and approximate geographical location to improve the visitor experience.
Certain type of cookies may require the data subject’s consent before storing them on the computer.
2. What are the different types of cookies?
This website uses two types of cookies:
- First party cookies. For our website, the first party cookies are controlled and maintained by Hamamatsu. No other parties have access to these cookies.
- Third party cookies. These cookies are implemented by organizations outside Hamamatsu. We do not have access to the data in these cookies, but we use these cookies to improve the overall website experience.
3. How do we use cookies?
This website uses cookies for following purposes:
- Certain cookies are necessary for our website to function. These are strictly necessary cookies and are required to enable website access, support navigation or provide relevant content. These cookies direct you to the correct region or country, and support security and ecommerce. Strictly necessary cookies also enforce your privacy preferences. Without these strictly necessary cookies, much of our website will not function.
- Analytics cookies are used to track website usage. This data enables us to improve our website usability, performance and website administration. In our analytics cookies, we do not store any personal identifying information.
- Functionality cookies. These are used to recognize you when you return to our website. This enables us to personalize our content for you, greet you by name and remember your preferences (for example, your choice of language or region).
- These cookies record your visit to our website, the pages you have visited and the links you have followed. We will use this information to make our website and the advertising displayed on it more relevant to your interests. We may also share this information with third parties for this purpose.
Cookies help us help you. Through the use of cookies, we learn what is important to our visitors and we develop and enhance website content and functionality to support your experience. Much of our website can be accessed if cookies are disabled, however certain website functions may not work. And, we believe your current and future visits will be enhanced if cookies are enabled.
4. Which cookies do we use?
There are two ways to manage cookie preferences.
- You can set your cookie preferences on your device or in your browser.
- You can set your cookie preferences at the website level.
If you don’t want to receive cookies, you can modify your browser so that it notifies you when cookies are sent to it or you can refuse cookies altogether. You can also delete cookies that have already been set.
If you wish to restrict or block web browser cookies which are set on your device then you can do this through your browser settings; the Help function within your browser should tell you how. Alternatively, you may wish to visit www.aboutcookies.org, which contains comprehensive information on how to do this on a wide variety of desktop browsers.
5. What are Internet tags and how do we use them with cookies?
Occasionally, we may use internet tags (also known as action tags, single-pixel GIFs, clear GIFs, invisible GIFs and 1-by-1 GIFs) at this site and may deploy these tags/cookies through a third-party advertising partner or a web analytical service partner which may be located and store the respective information (including your IP-address) in a foreign country. These tags/cookies are placed on both online advertisements that bring users to this site and on different pages of this site. We use this technology to measure the visitors' responses to our sites and the effectiveness of our advertising campaigns (including how many times a page is opened and which information is consulted) as well as to evaluate your use of this website. The third-party partner or the web analytical service partner may be able to collect data about visitors to our and other sites because of these internet tags/cookies, may compose reports regarding the website’s activity for us and may provide further services which are related to the use of the website and the internet. They may provide such information to other parties if there is a legal requirement that they do so, or if they hire the other parties to process information on their behalf.
If you would like more information about web tags and cookies associated with on-line advertising or to opt-out of third-party collection of this information, please visit the Network Advertising Initiative website http://www.networkadvertising.org.
6. Analytics and Advertisement Cookies
We use third-party cookies (such as Google Analytics) to track visitors on our website, to get reports about how visitors use the website and to inform, optimize and serve ads based on someone's past visits to our website.
You may opt-out of Google Analytics cookies by the websites provided by Google:
https://tools.google.com/dlpage/gaoptout?hl=en
As provided in this Privacy Policy (Article 5), you can learn more about opt-out cookies by the website provided by Network Advertising Initiative:
http://www.networkadvertising.org
We inform you that in such case you will not be able to wholly use all functions of our website.
Close

