Application notes


Technical notes
Ask an engineer


Publications
United States (EN)
Select your region or country.
How can NIR spectroscopy be used to analyze beverages?
Jay R. Powell, PhD, Analytical Answers Inc.
July 2, 2016
Spectroscopy is a branch of the physical sciences which studies and applies the interactions between electromagnetic radiation and matter. This field is further divided based on the wavelength range, such as X-ray spectroscopy, visible spectroscopy, infrared spectroscopy, and microwave spectroscopy, to name just a few. Hamamatsu offers instruments and components covering both the visible range, i.e., light we can "see" (300-700 nm), and the near-infrared range (700-2500 nm). This last near-infrared, or NIR, range has found numerous applications in a wide range of different chemical, material, environmental, and other analysis.
In the visible range, light can be absorbed by atoms and molecules through electronic transitions. Absorption of light of the right wavelength or energy by an atom or molecule leads to a decrease in the amount of light transmitted. In the condensed phase (liquids and solids), visible light absorption occurs from complex conjugated double bonds and aromatic rings in organic molecules, although many aqueous transition metal ions, through complexion with associated water molecules, can also form strongly-light-absorbing species. This absorption of light through electronic transitions produces the broad range of colors we perceive from solids and liquids.
In the NIR range, the energy carried by the NIR light is too low to excite the electronic transitions noted above, and thus the intensely colored species observed in the visible range have less of an influence in the NIR. In the NIR range, light absorption occurs through vibrational transitions, where absorption of light of the right wavelength or energy increases the vibrational mode between two atoms bonded together in a molecule. As NIR absorption does not require conjugated bonds or solvent complexes as in the visible, it is more sensitive to both the structure of the molecule and how that molecule interacts with nearby molecules. It is this sensitivity to the molecular structure and molecular environment which gives NIR spectroscopy its power.
The most common solvent used, in fact often referred to as the "universal solvent," is water. Water, through interaction with O-H stretching and H-O-H "scissoring" vibrational modes, is a weak NIR absorber. Figure 1 shows the NIR absorbance profile of water, covering approximately 800 to almost 1400 nm in wavelength, as measured in a 1 cm (10 mm) thick quartz cuvette. The Y axis shows the absorbance value, commonly abbreviated "A," and which is the negative base 10 log of the percent of the light transmitted at that wavelength (A = -log10(%T/100), where %T, a.k.a. %Transmittance, is the ratio of the light measured by the instrument with and without the sample in place, or %T = I/I0). Absorbance values are often preferred in such applications, as a simple relationship between absorbance, concentration, and sample thickness (or pathlength) is given by:
Equation 1
where Aλ = measured Absorbance at a given wavelength λ, c = concentration, b = sample thickness or "pathlength," and aλ = absorptivity of the species of interest at the given wavelength λ. Assuming that a constant pathlength cell is used, such as the common 1 cm cuvette described above, then the pathlength term can be ignored and the measured absorbance can be directly related to the concentration of the species of interest.
In Figure 1, we note three areas where water shows stronger absorbances: a broad band around 970 nanometers (nm), a stronger broad band around 1200 nm, and a very strong absorbance starting around 1300 nm and increasing to the end of the range near 1400 nm. These absorbance areas arise from the interactions between the O-H and H-O-H scissoring vibrations of the water molecules, and the broadness of the bands is due to the extended interactions, or "hydrogen bonding" between adjacent water molecules. These hydrogen bonding interactions can be used in characterizing aqueous systems.
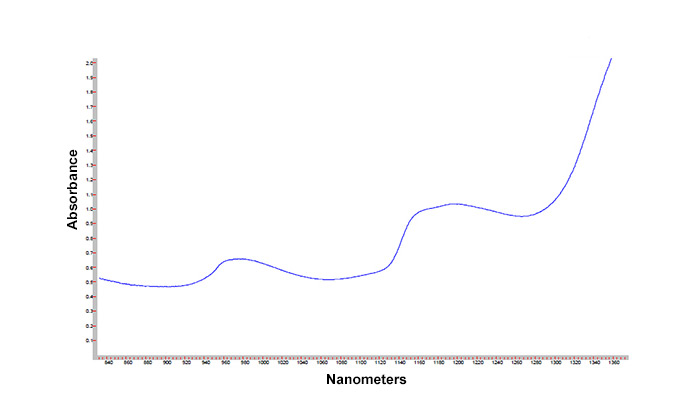
Figure 1. NIR absorbance profile of water
In Figure 2, three plots are presented showing deionized (DI) water, a diet beverage, and a regular beverage sweetened with a relatively high loading (ca 10% w/w) of one or more sugars. Note that in contrast to Figure 1, the strong absorbances in the DI water at 970, 1200, and 1300+ are no longer observed here, as these spectra were collected ratioed to DI water as a background reference. Using DI water as the background reference, if there is no difference in the interactions between water molecules between a sample and the DI water reference, little to no change will be observed in these regions. Adding more components to the (mostly) water beverages causes larger and larger changes in these absorbance bands, as seen by comparing the traces from the regular (sugar sweetened) beverage and diet (no sugars). Thus, one simple application of NIR spectroscopy using Hamamatsu instrumentation is to differentiate between sugar-sweetened and artificially sweetened beverages.
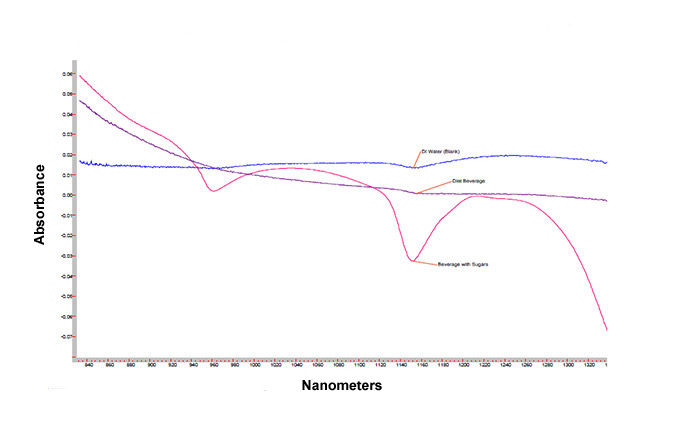
Figure 2. NIR absorbance profiles of water (blue curve), diet beverage (purple curve), and beverage with sugar(s) (red curve)
Instrumentation components for a beverage analyzer
For NIR absorbance measurements, there are four major components required. An overview of these components is presented in Figure 3.
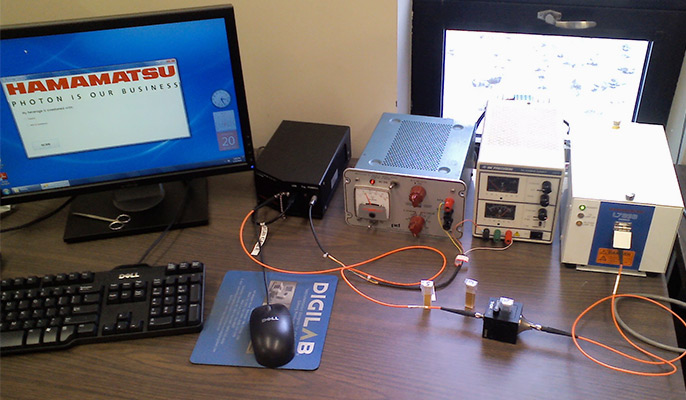
Figure 3. Components of Hamamatsu beverage analyzer
First, a strong and stable source of NIR light is required. A strong or "bright" source is desired, in order to minimize the impact of light transfer and sampling losses. A stable source, that is a source whose output does not measurably change over time, is necessary as such changes in source output from one measurement to the next will be indistinguishable from the differences we are trying to measure in our samples. Here, we have used the Hamamatsu L7893 D2 / Quartz Halogen UV-Vis-NIR light source. This switch-selectable light source allows selection of the D2 lamp for UV-Vis sampling, or the Quartz Halogen NIR source, which is used here.
Next, a method to transfer the light from the source to the sample is needed. Here, creativity in optical coupling can be used, often based on optical tables, mirrors, and focusing lenses to move the light from the source to the sample, and from the sample onwards. One easy method to do this in the NIR range is to use dedicated NIR fiber optics, which are based on fine silica fibers formulated to minimize light scattering and loss from other foreign species, such as hydroxyl (-O-H) groups. In addition, as a reproducible sample thickness or pathlength is required, a standard 1 cm (10 mm) pathlength quartz cuvette is used, which is held in a dedicated cuvette holder with fiber optic connections. Here, we have used a pair of ThorLabs TP01195070 optical fibers with industry-standard SMA connectors to take light from the Hamamatsu L7893 source (also with industry standard SMA connectors) to a ThorLabs CVH100 cuvette holder with a pair of SMA connectors (one for light going in, one for light going out), with our samples and water reference solutions held in Pike Technologies 162-0223 glass cuvettes with covers. This is shown in more detail in Figure 4. These cuvettes are the most common visible to NIR range sampling accessory, are available from a wide variety of sources, are easy to clean, and are relatively inexpensive.
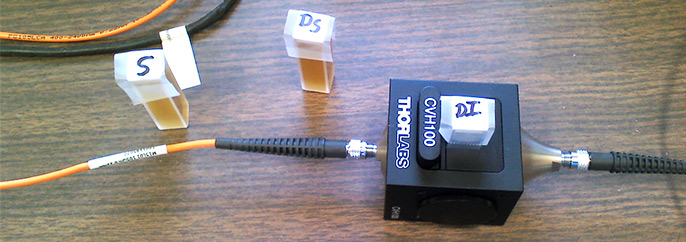
Figure 4. Quartz cuvettes, holder, and fiber light guides
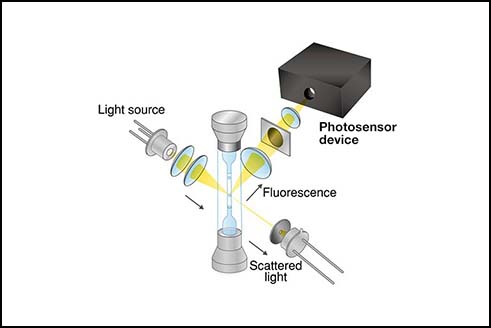
Finally, the NIR light, after passing through the sample, has to be measured. A dispersive spectrometer collects the light, and separates or disperses it into the individual wavelengths. Here, we have used a Hamamatsu C11118GA dispersive spectrometer, with a thermoelectrically cooled integrated array detector, covering the range of 850 nm out to 2,500 nm (or 2.5 μm, which is the edge of the mid-infrared region of 2.5 μm to 25 μm). Here, our spectrometer and detector range is well beyond the range needed for our beverage analyzer. However, substitution of other source, light transfer, and sampling components allows easy reconfiguration of this spectrometer for other applications.
Controlling the beverage analyzer spectrometer
While the selected hardware components offer a very powerful and capable combination, these components on their own will not supply us with the differentiation between the artificial and sugar sweetened beverages we wish to demonstrate. Here, additional communications, control, and data acquisition of the C11118GA system is provided through a Hamamatsu software interface package. This interface package allows easy definition, access, control, and acquisition of the C11118GA spectrometer through common development tools, such as Microsoft Visual Studio’s Visual Basic (VB). Figure 5 shows an example of using these interfacing tools in VB, where the program calls up the function to acquire the spectral data from the spectrometer.
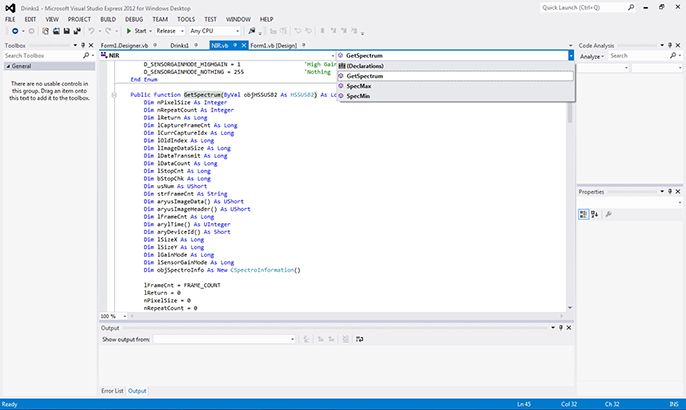
Figure 5. Example of "GetSpectrum" data acquisition from Hamamatsu's spectrometer interface
VB then provides the tools to easily lay out windows, screens, menus, and function buttons as part of a dedicated graphical user interface (GUI) for our beverage analyzer (Figure 6).
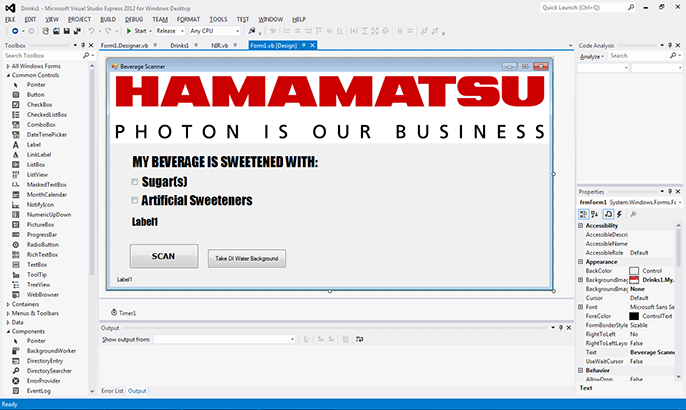
Figure 6. Visual Basic layout for beverage analyzer
In modern programming environments, program control occurs through a combination of objects, properties, events, and methods. For example, Figure 7 shows code written for the "btnScan_Click," an event which is "fired" when the user clicks on the "Scan" button seen in Figure 6. Here, Figure 7 shows that only a small amount of code is needed to first define variables to hold information (the Dim statements), reset the display, and then get a spectrum from the C11118GA "GetSpectrum" method. The remainder of the code shown then ratios the collected spectrum to the DI water background, and calculates the absorbance spectrum from the ratio spectrum.
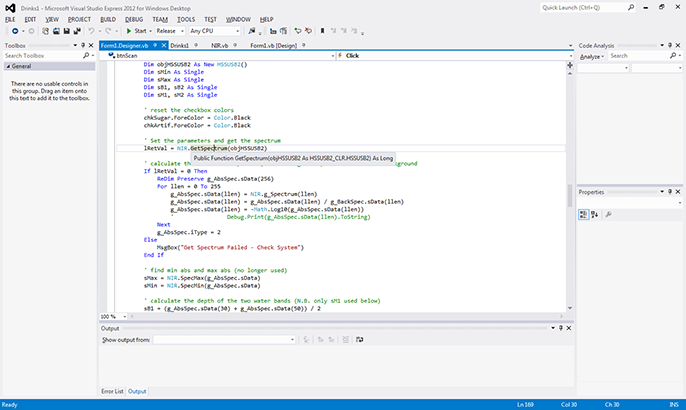
Figure 7. Calling Hamamatsu's data acquisition in Visual Basic
Once the spectral data has been acquired, the programmer can then manipulate the data as necessary to extract the desired chemical information from the data array. For example, Figure 2 shows the NIR spectra of sugar-sweetened and artificially sweetened beverages (along with water), and Figure 8 shows the programmer’s "cross-check" on the data acquired, where the data has been exported into an Excel format and plotted to verify the program calculation steps are operating correctly. Note that in Figure 8, the peaks located at the X-axis values of 15 and 40 correspond to the peaks shown in Figure 2 at 970 and 1200 nanometers. Thus, the acquired spectrum can now be measured by selecting important peaks (based on pixel number or wavelength), baselines determined, band areas calculated, and converted to meaningful information for presentation to the operator.
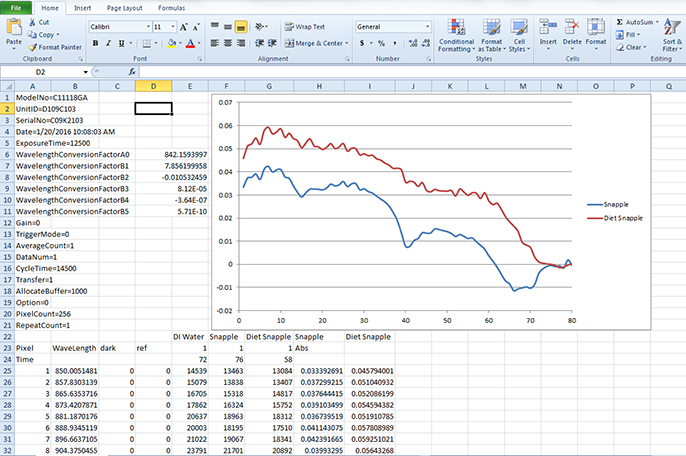
Figure 8. Excel cross-check on captured spectra
Once Hamamatsu’s interface package has been defined in a VB project, the developer can then concentrate on program design, flow, data manipulation, and the user interface. For our beverage analyzer, we first want to prompt the operator to collect a blank distilled or deionized (DI) water sample, which will be used as the background reference. This is shown in Figure 9, where all the other dialog box components shown in Figure 6 are automatically hidden until the DI water background is collected.

Figure 9. Initial screen, prompting operator to collect DI water background spectrum
Once the DI water background is collected, the operator can then choose if they believe the beverage is sweetened with sugar(s) or artificial sweetener(s), shown in Figure 10.
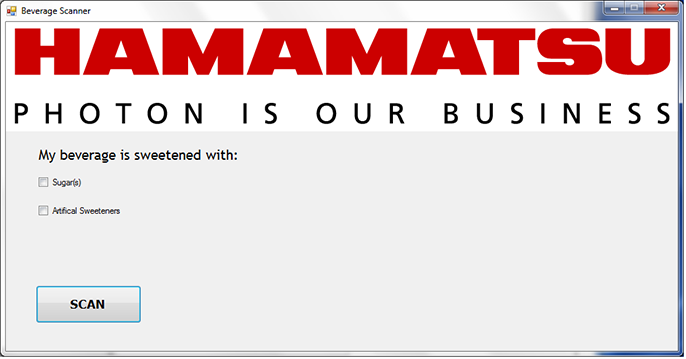
Figure 10. Prompt to choose sweetener and start scan
The spectrum of the beverage is then collected and measured based on the selected pixels or wavelengths as shown in Figure 8 and Figure 2. If the measurements show large peaks at these locations, the program can then display a message indicating sugar(s) present (Figure 11), or alternately, if the measurements show minor or no peaks in those locations, the program can display a message indicating no sugar(s) present (Figure 12).
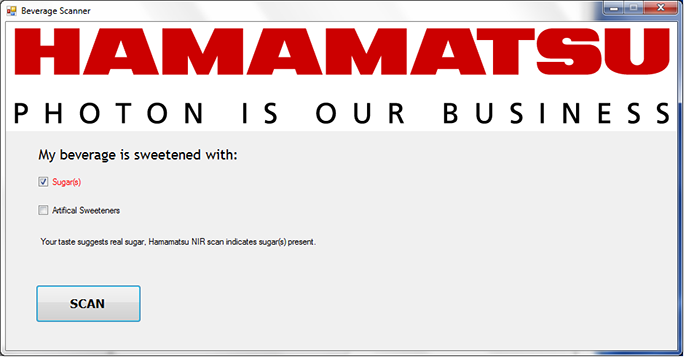
Figure 11. Operator chose sugar(s) and the beverage analyzer also finds sugar(s)
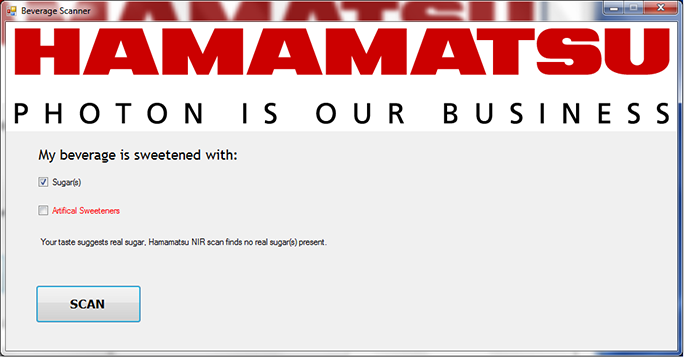
Figure 12. Operator chose sugar(s) but the beverage analyzer detected no sugar(s)
Although the creation of this "beverage analyzer" was not intended to be a commercial product, it does show the relative ease in using a Hamamatsu spectrometer system and interface package. Here, in conjunction with common optical components and simple programming tools, relatively sophisticated UV-Vis-NIR analyzers can be easily designed and implemented.
- Confirmation
-
It looks like you're in the . If this is not your location, please select the correct region or country below.
You're headed to Hamamatsu Photonics website for US (English). If you want to view an other country's site, the optimized information will be provided by selecting options below.
In order to use this website comfortably, we use cookies. For cookie details please see our cookie policy.
- Cookie Policy
-
This website or its third-party tools use cookies, which are necessary to its functioning and required to achieve the purposes illustrated in this cookie policy. By closing the cookie warning banner, scrolling the page, clicking a link or continuing to browse otherwise, you agree to the use of cookies.
Hamamatsu uses cookies in order to enhance your experience on our website and ensure that our website functions.
You can visit this page at any time to learn more about cookies, get the most up to date information on how we use cookies and manage your cookie settings. We will not use cookies for any purpose other than the ones stated, but please note that we reserve the right to update our cookies.
1. What are cookies?
For modern websites to work according to visitor’s expectations, they need to collect certain basic information about visitors. To do this, a site will create small text files which are placed on visitor’s devices (computer or mobile) - these files are known as cookies when you access a website. Cookies are used in order to make websites function and work efficiently. Cookies are uniquely assigned to each visitor and can only be read by a web server in the domain that issued the cookie to the visitor. Cookies cannot be used to run programs or deliver viruses to a visitor’s device.
Cookies do various jobs which make the visitor’s experience of the internet much smoother and more interactive. For instance, cookies are used to remember the visitor’s preferences on sites they visit often, to remember language preference and to help navigate between pages more efficiently. Much, though not all, of the data collected is anonymous, though some of it is designed to detect browsing patterns and approximate geographical location to improve the visitor experience.
Certain type of cookies may require the data subject’s consent before storing them on the computer.
2. What are the different types of cookies?
This website uses two types of cookies:
- First party cookies. For our website, the first party cookies are controlled and maintained by Hamamatsu. No other parties have access to these cookies.
- Third party cookies. These cookies are implemented by organizations outside Hamamatsu. We do not have access to the data in these cookies, but we use these cookies to improve the overall website experience.
3. How do we use cookies?
This website uses cookies for following purposes:
- Certain cookies are necessary for our website to function. These are strictly necessary cookies and are required to enable website access, support navigation or provide relevant content. These cookies direct you to the correct region or country, and support security and ecommerce. Strictly necessary cookies also enforce your privacy preferences. Without these strictly necessary cookies, much of our website will not function.
- Analytics cookies are used to track website usage. This data enables us to improve our website usability, performance and website administration. In our analytics cookies, we do not store any personal identifying information.
- Functionality cookies. These are used to recognize you when you return to our website. This enables us to personalize our content for you, greet you by name and remember your preferences (for example, your choice of language or region).
- These cookies record your visit to our website, the pages you have visited and the links you have followed. We will use this information to make our website and the advertising displayed on it more relevant to your interests. We may also share this information with third parties for this purpose.
Cookies help us help you. Through the use of cookies, we learn what is important to our visitors and we develop and enhance website content and functionality to support your experience. Much of our website can be accessed if cookies are disabled, however certain website functions may not work. And, we believe your current and future visits will be enhanced if cookies are enabled.
4. Which cookies do we use?
There are two ways to manage cookie preferences.
- You can set your cookie preferences on your device or in your browser.
- You can set your cookie preferences at the website level.
If you don’t want to receive cookies, you can modify your browser so that it notifies you when cookies are sent to it or you can refuse cookies altogether. You can also delete cookies that have already been set.
If you wish to restrict or block web browser cookies which are set on your device then you can do this through your browser settings; the Help function within your browser should tell you how. Alternatively, you may wish to visit www.aboutcookies.org, which contains comprehensive information on how to do this on a wide variety of desktop browsers.
5. What are Internet tags and how do we use them with cookies?
Occasionally, we may use internet tags (also known as action tags, single-pixel GIFs, clear GIFs, invisible GIFs and 1-by-1 GIFs) at this site and may deploy these tags/cookies through a third-party advertising partner or a web analytical service partner which may be located and store the respective information (including your IP-address) in a foreign country. These tags/cookies are placed on both online advertisements that bring users to this site and on different pages of this site. We use this technology to measure the visitors' responses to our sites and the effectiveness of our advertising campaigns (including how many times a page is opened and which information is consulted) as well as to evaluate your use of this website. The third-party partner or the web analytical service partner may be able to collect data about visitors to our and other sites because of these internet tags/cookies, may compose reports regarding the website’s activity for us and may provide further services which are related to the use of the website and the internet. They may provide such information to other parties if there is a legal requirement that they do so, or if they hire the other parties to process information on their behalf.
If you would like more information about web tags and cookies associated with on-line advertising or to opt-out of third-party collection of this information, please visit the Network Advertising Initiative website http://www.networkadvertising.org.
6. Analytics and Advertisement Cookies
We use third-party cookies (such as Google Analytics) to track visitors on our website, to get reports about how visitors use the website and to inform, optimize and serve ads based on someone's past visits to our website.
You may opt-out of Google Analytics cookies by the websites provided by Google:
https://tools.google.com/dlpage/gaoptout?hl=en
As provided in this Privacy Policy (Article 5), you can learn more about opt-out cookies by the website provided by Network Advertising Initiative:
http://www.networkadvertising.org
We inform you that in such case you will not be able to wholly use all functions of our website.
Close